Norwegian Cruise Line reports results for fourth quarter and full year
Norwegian Cruise Line (NCL Corporation Ltd., “Norwegian” or “the Company”) today reported results for the three and twelve months ended December 31, 2010.
2010 Company Highlights
* Record EBITDA of $400.4 million
* Net Yield increase of 7.7% and Net Revenue increase of 12.1% compared to prior year
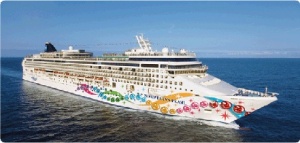
* Successful introduction of Norwegian Epic, the Company’s largest-ever Freestyle Cruising ship
* Contract for two 4,000-berth Freestyle Cruising vessels for delivery in spring 2013 and spring 2014
Norwegian continued demonstrating improved financial performance in 2010 with strong increases in EBITDA, Net Yield and Net Revenue. EBITDA improved 23.6% to $400.4 million, setting a Company record. “I am extremely pleased with our results in 2010, especially after successfully navigating through the challenging economic environment of late 2008 and 2009,” said Kevin Sheehan, president and chief executive officer. “Improved ticket pricing and onboard spending, along with the benefits of our strategic initiatives, combined to drive Norwegian’s record results in 2010, setting up the year as the most successful in the Company’s history. Not only did we set an EBITDA record for a full year, it was also the fourth consecutive year of double-digit EBITDA growth.”
Company milestones for the year included the successful introduction of the Company’s largest and most innovative vessel to date, Norwegian Epic, to enthusiastic reviews from the travel media and the cruising public. Norwegian Epic has since settled into her seven-night alternating Eastern and Western Caribbean itineraries and will reposition to Europe for an extended summer season. The Company announced in the fourth quarter that it would expand its purpose-built Freestyle Cruising fleet by contracting for two 4,000-berth ships for delivery in spring 2013 and 2014. Said Sheehan, “Every team member at Norwegian has worked diligently over the last three years to generate consistently improving results and put the Company on firm financial footing. We now move ahead with the next chapter of Norwegian’s story of growth and innovation. These two new ships will take the best aspects of our current fleet along with new elements to create the innovative vacations that our guests have come to expect from Norwegian.”
Full Year Results
ADVERTISEMENT
EBITDA for the twelve months ended December 31, 2010 increased 23.6% to $400.4 million from $324.1 million in 2009 (Adjusted EBITDA was $404.7 million in 2010 compared to $332.5 million in 2009). Net Revenue increased to $1.5 billion from $1.3 billion as a result of a 7.7% increase in Net Yield coupled with a 4.0% increase in Capacity Days. The improvement in Net Yield came as a result of both improved ticket pricing and onboard and other revenue per Capacity Day. The growth in Capacity Days was the result of the addition of Norwegian Epic to the fleet in June 2010 and was partially offset by the departure of Norwegian Majesty from the fleet in October 2009. Occupancy percentage in 2010, which included the planned phase-in period for Norwegian Epic, was 108.7% versus 109.4% in the prior year.
Net Cruise Cost per Capacity Day increased 4.2% primarily due to a 28.3% increase in the average cost of fuel to $490 per metric ton in 2010 from $382 per metric ton in 2009. Excluding fuel expense, Net Cruise Cost per Capacity Day was essentially flat versus prior year.
Interest expense, net of capitalized interest, increased to $173.8 million for the year compared to $115.4 million in 2009 due to an increase in borrowings related to the addition of Norwegian Epic and higher average interest rates. Other income (expense) was $(34.0) million in 2010 versus income of $10.4 million in 2009 primarily due to a non-recurring charge of $33.1 million related to foreign exchange contracts associated with the financing of Norwegian Epic in 2010 compared to gains from fuel derivatives in 2009.
Net income for the year, including the impact of the aforementioned loss on foreign exchange contracts was $22.6 million on revenue of $2.0 billion versus net income of $67.2 million on revenue of $1.9 billion in 2009.
Fourth Quarter Results
EBITDA for the fourth quarter of 2010 increased 69.7% to $63.4 million from $37.4 million in 2009 (Adjusted EBITDA was $64.3 million in 2010 and $41.6 million in 2009). Net Revenue increased 23.7% to $355.7 million from $287.6 million in 2009 driven by a 7.0% improvement in Net Yield and a 15.6% increase in Capacity Days. The improvement in Net Yield was a result of improved ticket pricing as well as improved onboard and other revenue per Capacity Day. Capacity Days increased due to the addition of Norwegian Epic to the fleet. Occupancy percentage for the quarter was 104.6% versus 106.0% in 2009.
Net Cruise Cost per Capacity Day in the quarter increased 1.0% over prior year. An increase in Other Cruise Operating Expense per Capacity Day, together with an increase in the average cost of fuel to $486 per metric ton from $467 per metric ton in 2009 were offset by lower general and administrative, payroll, and food expense per Capacity Day.
Interest expense, net of capitalized interest, increased to $54.7 million for the quarter compared to $37.5 million in 2009 due to an increase in borrowings related to the addition of Norwegian Epic and higher average interest rates. Taking into account the higher interest expense, net loss for the fourth quarter of 2010 was flat to prior year at $39.3 million compared to $39.0 million in 2009.
Terminology and Non-GAAP Financial Measures
Berths. Double occupancy capacity per cabin even though many cabins can accommodate three or more passengers.
Capacity Days. Berths multiplied by the number of cruise days for the period.
EBITDA. Earnings before interest, other income (expense) including taxes, impairment loss, and depreciation and amortization.
Gross Cruise Cost. The sum of total cruise operating expense and marketing, general and administrative expense.
Gross Yield. Total revenue per Capacity Day.
Net Cruise Cost. Gross Cruise Cost less commissions, transportation and other expense and onboard and other expense.
Net Cruise Cost Excluding Fuel. Net Cruise Cost less fuel expense.
Net Per Diem. Net Revenue per Passenger Cruise Day.
Net Revenue. Total revenue less commissions, transportation and other expense and onboard and other expense.
Net Yield. Net Revenue per Capacity Day.
Occupancy Percentage or Load Factor. The ratio of Passenger Cruise Days to Capacity Days. A percentage in excess of 100% indicates that three or more passengers occupied some cabins.
Passenger Cruise Days. The number of passengers carried for the period, multiplied by the number of days in their respective cruises.
Non-GAAP Information
To supplement the Company’s consolidated financial statements presented in accordance with U.S. generally accepted accounting principles (“GAAP”), the Company also provides certain non-GAAP financial measures, including EBITDA, Net Revenue, Net Yield, and Net Cruise Cost.
We define EBITDA as earnings before interest, other income (expense) including taxes, impairment loss, and depreciation and amortization and is used by management to measure operating performance of the business. Management believes EBITDA, when considered along with other performance measures, is a useful measure as it reflects certain operating drivers of the Company’s business, such as sales growth, operating costs, marketing, general and administrative expense and other operating income and expense. EBITDA is also one of the measures used by the Company to calculate incentive compensation for management-level employees. This non-GAAP financial measure has certain material limitations, including:
* It does not include net interest expense. As the Company has borrowed money for general corporate purposes, interest expense is a necessary element of its costs and ability to generate profits and cash flows; and
* It does not include depreciation and amortization expense. As the Company uses capital assets, depreciation and amortization are necessary elements of its costs and ability to generate profits and cash flows.
Management compensates for these limitations by using EBITDA as only one of several measures for evaluating the Company’s business performance. In addition, capital expenditures, which impact depreciation and amortization expense, interest expense and income tax expense, are reviewed separately by management. Management believes EBITDA can provide a more complete understanding of the underlying operating results and trends and an enhanced overall understanding of the Company’s financial performance and prospects for the future. EBITDA is not intended to be a measure of liquidity or cash flows from operations or measures comparable to net income as it does not take into account certain requirements such as capital expenditures and related depreciation, principal and interest payments and tax payments.
We define Adjusted EBITDA as EBITDA with supplemental adjustments. Each adjustment and the reasons we consider them appropriate for supplemental analysis should be evaluated. In evaluating Adjusted EBITDA, be aware that in the future we may incur expenses similar to the adjustments in this presentation. Our presentation of Adjusted EBITDA should not be construed as an inference that our future results will be unaffected by unusual or non-recurring items. Adjusted EBITDA is not intended to be a measure of liquidity or cash flows from operations or measures comparable to net income as it does not take into account certain requirements such as capital expenditures and related depreciation, principal and interest payments and tax payments, and it is subject to certain additional adjustments. Our use of Adjusted EBITDA may not be comparable to other companies within our industry.
We use certain non-GAAP financial measures, such as Net Revenue, Net Yield and Net Cruise Cost to enable us to analyze our performance. We utilize Net Revenue and Net Yield to manage our business on a day-to-day basis and believe that they are the most relevant measures of our revenue performance because they reflect the revenue earned by us net of significant variable costs and are commonly used in the cruise industry to measure revenue performance. In measuring our ability to control costs in a manner that positively impacts net income, we believe changes in Net Cruise Cost and Net Cruise Cost Excluding Fuel to be the most relevant indicators of our performance and are commonly used in the cruise industry as a measurement of costs. Accordingly, we do not believe that reconciling information for such projected figures would be meaningful. Our use of non-GAAP financial measures may not be comparable to other companies within our industry.